Project Economics
Tracking project budgets, actual costs and the forecast cost at completion. EVM, variances and how to spot financial trouble before it gets out of hand.
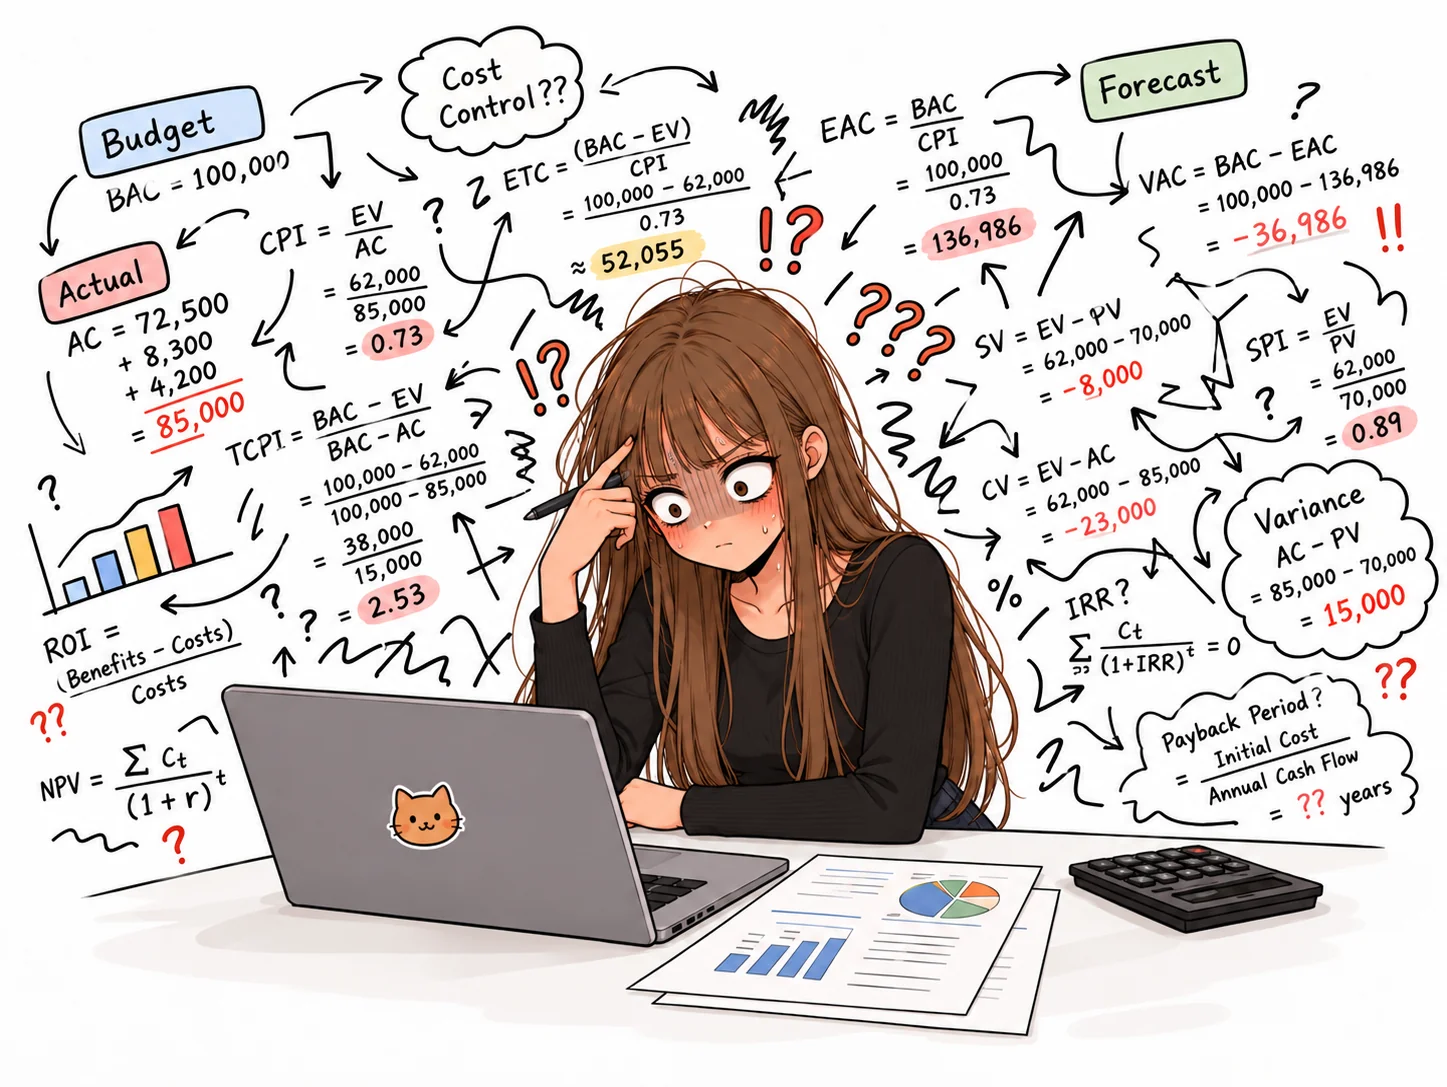
The budget is signed off
A company is building a customer portal. The estimate is approved, the timeline is agreed and the budgeted project cost is RUB 1 million. The client is paying RUB 1.3 million, leaving an expected profit of RUB 300,000 before any costs excluded from the estimate. All that’s left is to deliver the work, stay within budget and avoid quietly rewriting the numbers after the fact.
Financial control means keeping revenue, the project’s cost base and actual expenditure separate. Project costs include the team, contractors, infrastructure and other resources. Count only developers’ hours and the final numbers may come as an unpleasant surprise.
Two months in, the team has spent RUB 500,000. If 70% of the work is done, that sounds promising. If it’s only 30%, it’s time to investigate. Tracking the budget without tracking actual progress is fairly pointless.
EVM: the plan meets reality
Earned Value Management (EVM) compares the budgeted cost of planned work, the budgeted value of completed work and what you’ve actually spent.
| Measure | Meaning |
|---|---|
| BAC (Budget at Completion) | The approved budget for the whole project |
| PV (Planned Value) | The budgeted cost of work scheduled by the reporting date |
| EV (Earned Value) | The budgeted value of work actually completed |
| AC (Actual Cost) | The actual cost incurred |
By the end of month two, the team was supposed to have completed 50% of the work. It has actually completed 40% and already spent half the budget.
| Measure | Value |
|---|---|
| BAC | RUB 1,000,000 |
| PV (50%) | RUB 500,000 |
| EV (40%) | RUB 400,000 |
| AC | RUB 500,000 |
Work budgeted at RUB 400,000 has cost RUB 500,000 to deliver. And the team is behind schedule too.
You need a reliable way to measure completion. EV comes from the approved budgeted value of completed work, not hours logged or invoices sent to the client. You can declare a feature 90% done, make the dashboard look lovely and then spend another month waiting for it to be finished.
Variances and performance indices
EVM uses four core metrics to assess how the project is doing.
| Metric | Formula | Result |
|---|---|---|
| CV — Cost Variance | EV − AC | −RUB 100,000 |
| SV — Schedule Variance | EV − PV | −RUB 100,000 |
| CPI — Cost Performance Index | EV / AC | 0.80 |
| SPI — Schedule Performance Index | EV / PV | 0.80 |
Negative CV and SV mean the completed work has cost more than budgeted and less work has been completed than planned. For the indices, 1 is the reference point. Below 1 means performance is unfavourable.
CPI = 0.80 means every rouble spent has delivered RUB 0.80 of work at its budgeted value. SPI = 0.80 means the team has completed 80% of the work planned by this date. SV is measured in money, not days. It won’t directly tell you when the project will finish.
The metrics won’t explain the causes. Cost overruns can come from poor estimates, rework or expensive specialists. Delays might come from dependencies, unclear requirements or slow approvals. The numbers flag the problem. Then the PM’s work starts.
Forecasting the final project cost
Knowing you’re overspending is useful. Knowing what the whole project is likely to cost is even more interesting. That’s where EAC (Estimate at Completion) comes in: the forecast total cost of the project.
If the current cost performance continues:
EAC = BAC / CPI
1,000,000 / 0.80 = RUB 1,250,000.
You can also calculate ETC (Estimate to Complete), the forecast cost of the remaining work, and VAC (Variance at Completion), the expected difference between the budget and the final cost.
| Measure | Formula | Result |
|---|---|---|
| EAC | BAC / CPI | RUB 1,250,000 |
| ETC | EAC − AC | RUB 750,000 |
| VAC | BAC − EAC | −RUB 250,000 |
The forecast depends on your assumptions. If the overrun was a one-off and you expect to complete the remaining work at the original budgeted cost, use a different formula:
EAC = AC + (BAC − EV)
500,000 + (1,000,000 − 400,000) = RUB 1,100,000.
That gives us two scenarios: RUB 1.1 million if the remaining work returns to budgeted cost performance, or RUB 1.25 million if current performance continues. If conditions have changed significantly, re-estimate the remaining work with the team. Don’t leave it all to a formula.
Now look at the contract economics. At a fixed price of RUB 1.3 million, the expected profit was RUB 300,000. If costs reach RUB 1.25 million, only RUB 50,000 is left. The calculated margin falls from roughly 23% to 4%, assuming the price stays the same and the calculation includes the same cost categories.
Technically, the project is still profitable. The safety margin is almost a rounding error.
What to do with the numbers
If EVM shows a cost overrun, start by checking the inputs and the reasons behind the variance. Then re-estimate the remaining work and review team capacity, contractor costs, requirement changes and unplanned rework. Update the forecast and decide what to do: reallocate resources, revise the scope, agree on paid change requests or adjust the timeline.

It isn’t the right tool for every project. EVM needs an approved baseline, reliable cost tracking and measurable progress. On a small project with constantly changing requirements, it may be overkill. Time-and-materials (T&M) contracts also need close attention to billable hours, the client’s budget cap and actual profitability. EVM doesn’t replace commercial reporting.
I’d watch the trends and the forecast at completion. A one-off variance might be down to the stage the project is at. A CPI that keeps falling is a reason to revisit the project economics while you can still do something about them.
Telling management you’ve overspent after the budget is gone does technically count as reporting. It has very little to do with managing the money, though.

I’m a project manager. About working with russian clients and teams, sharing experience and things I’ve noticed.